The Barabási – Albert paper “Emergence of Scaling in Random Networks” helped popularise the preferential-attachment model of graphs, and its relevance to a number of real-world graphs. There’s a small, somewhat trivial tweak to that model that can be made which never the less changes its characteristics slightly, with the result possibly being more relevant to the BGP AS graph. GNU Octave and Java implementations are given for the original BA-model and the tweak. The tweak can also potentially improve performance of vectorised implementations, such as Octave/Matlab.
Preferential attachment as a model of growth in graphs is the idea that new nodes that come along prefer, probabilistically, to link to those existing nodes that already have the most links. This results in graphs where, after time, most nodes have a low number of links, a small number have many links, and a very small number have a lot of links. The resulting graph will be a “small-world”: all the nodes will be a low-number of hops from each other, the small number of highly connected nodes acting as hubs.The distribution of the degrees of the nodes follows a power-law decay.
Many networks in the real-world appear to have the power-law degree distribution and small-world properties. The Barabási-Albert paper gives examples such as nervous system networks, social networks and the World Web. The BGP AS graph similarly displays a power-law degree distribution:

Plot of a histogram of the degree distribution of ASes, as seen in the UCLA IRL Topology database. Nonlinear, least-square fit of power-law models over the oldest and newest data-sets, over the ranges shown.
This of course doesn’t tell us much about the structure of the Internet. To get a qualitative, visual sense, we can plot the graph using the eigencentralities of the nodes, (which is a weighting of the nodes such that every node’s weight is the sum of its neighbours weights – think of it as a “PageRank” for graphs). We can use the relative eigencentrality ranking of the ASes in the BGP AS graph to sort them, and then plot the adjacency matrix, with a dot to indicate a connection between the AS on the X axis, and the AS on the Y axis. As the AS graph is undirected, the resulting plot will be symmetric. It looks like:
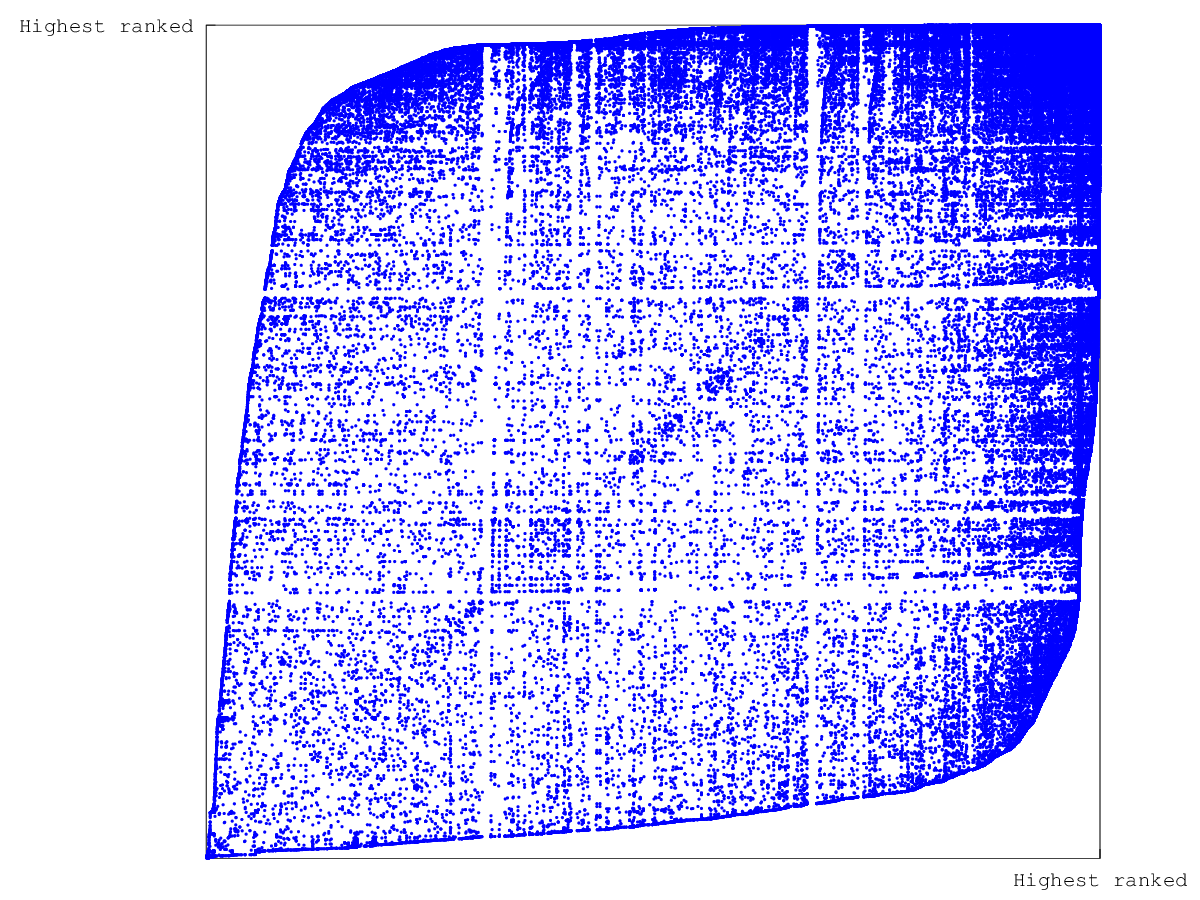
Sparsity plot of the adjacency matrix of the BGP AS graph, based on UCLA IRL Topology data trimmed to the 16-bit AS space, with the nodes ordered by their Eigencentrality ranking.
This shows there are high-ranking nodes which have very dense interconnections, and other nodes with progressively fewer connections. There is also a clear outline, particularly at lower rankings, suggesting some kind of relationship or correlation in the connectivity of consecutively ranked nodes.
What does the Barabási-Albert model look like? First, it has 2 parameters, the “m0” parameter, governing how many edges should exist in the graph initially (which I take to be m0+1 nodes linked in a chain), and the “m” parameter, governing how many edges should be created from a new node to the existing nodes in the graph. One new node is added per step of the model. The resulting eigencentrality plot for m=1, m0=2 looks like:
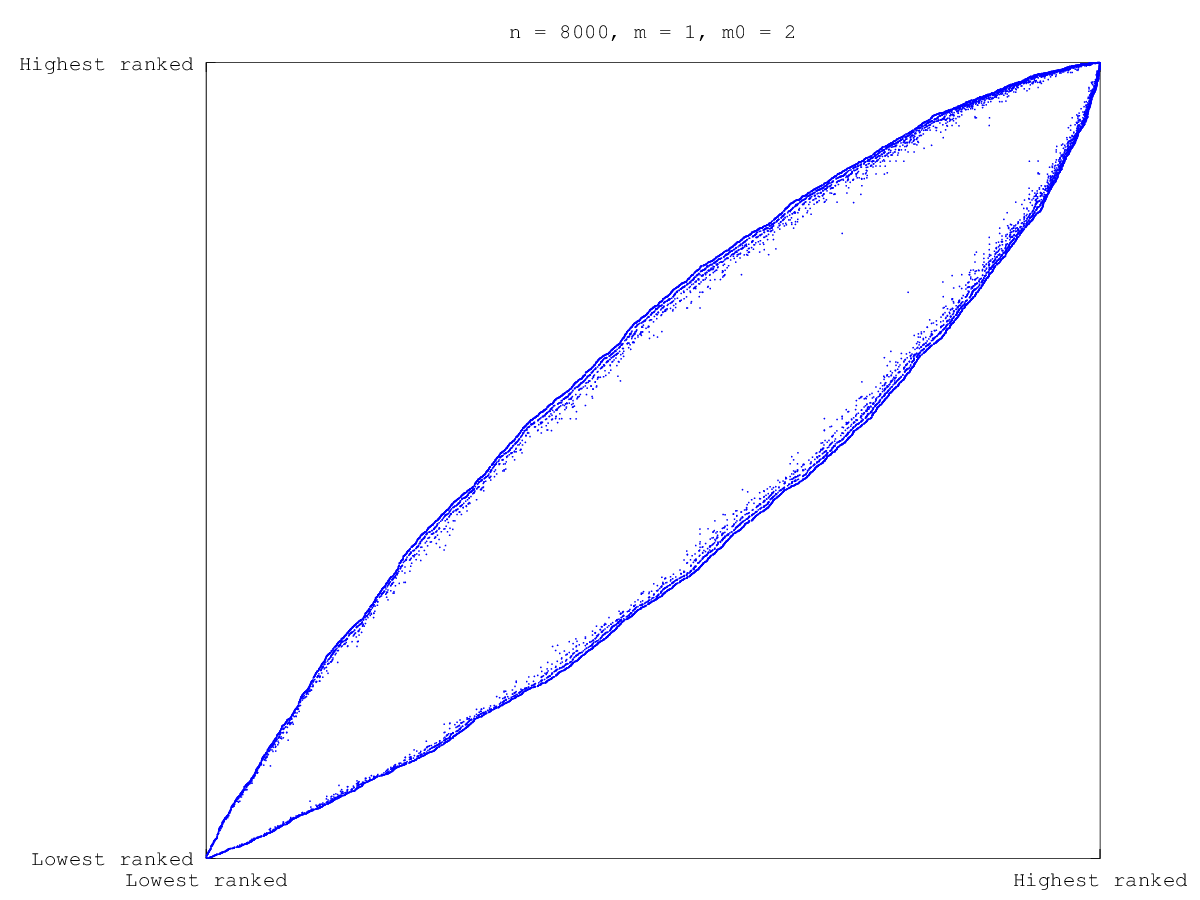
BA Model eigencentrality-ordered adjacency matrix sparsity plot, with 8000 nodes and m=1, m0=2 parameters.
This seems to result in a graph where each node has connections to up to 2 clusters of similarly ranked nodes, one higher ranked the other lower ranked. This outline seems somewhat consistent with the similar feature visible in the BGP AS graph plot. However, it’s missing the range of connections between the extremes. Indeed, with m=1 the BA-model graph should be a tree, as each new node creates only 1 edge to the existing nodes, and so no new edge can create a cycle. The BGP AS graph however is not a tree, indeed it known to have much stronger interconnectivity.
What if we increase the m parameter and add 2 edges for each node?:
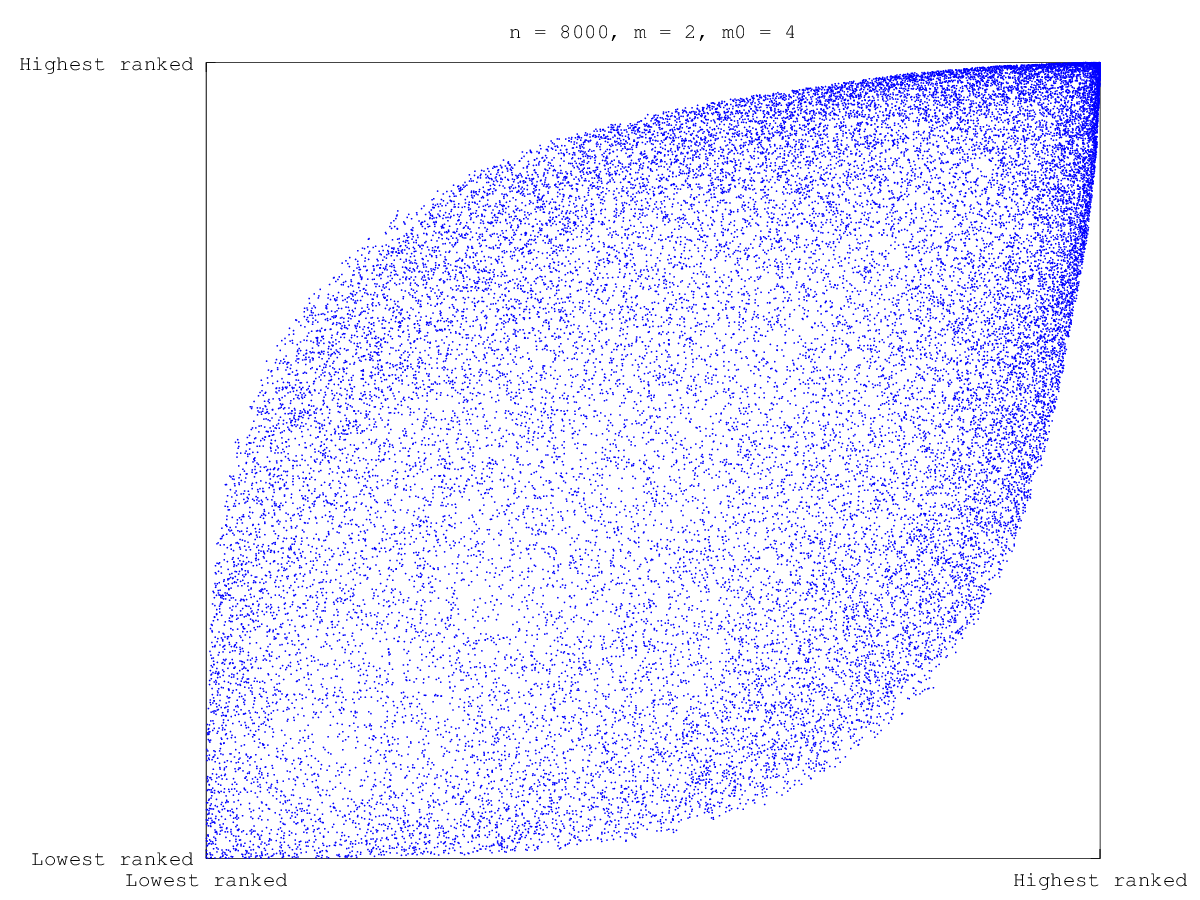
BA Model eigencentrality-ordered adjacency matrix sparsity plot, with 8000 nodes and m=2, m0=4 parameters.
This seems fairly clearly to result in a graph with much more connectivity. Visually, the diversity of connections across ranks seems more in tune with the Internet graphs. However, the clear outline, that correlation of extremal connections between consecutive ranks that is visible in the BGP AS graph and the m=1 BA-model, appears to have been lost. This is not due to an unfortunate choice of m0 and m parameters. The m0 parameter is not very significant, and the m parameter controls the outcome largely, leading quickly to a saturated graph as it is increased, as can be seen from this overview:
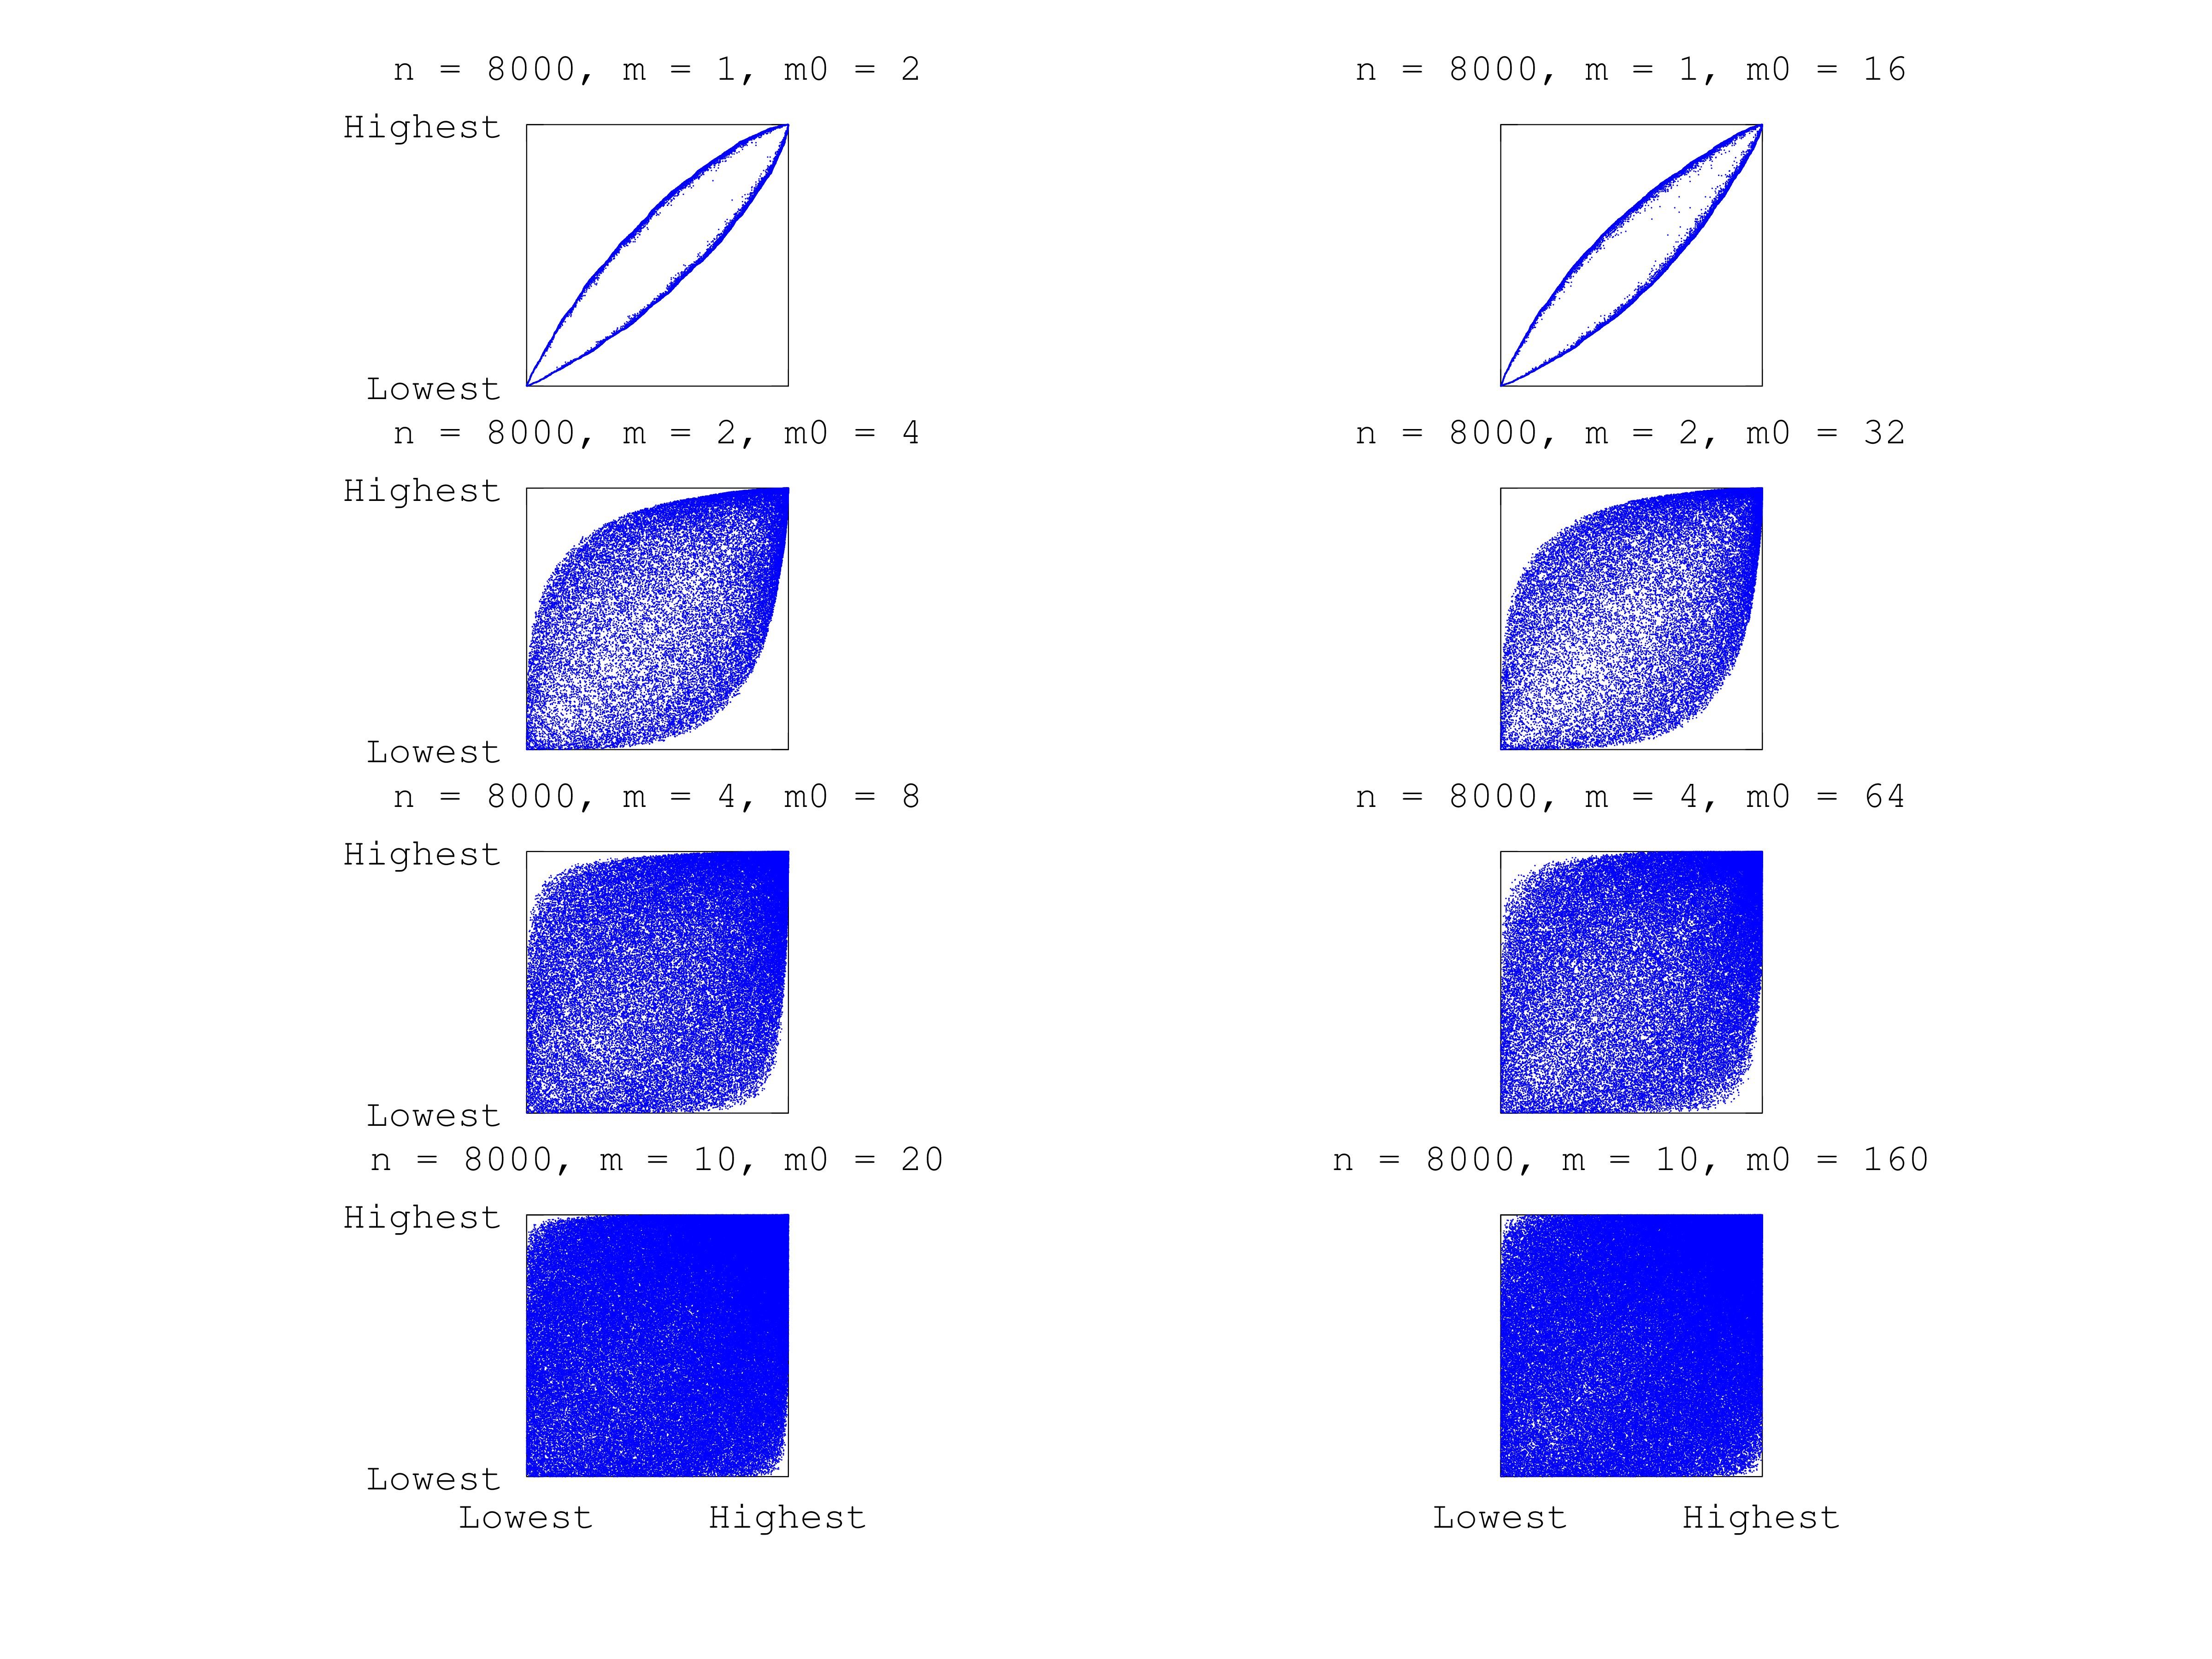
BA Model eigencentrality-ordered adjacency matrix sparsity plots, with 8000 nodes. Overview over a wide range of the m and m0 parameters.
It seems the BGP AS graph, in a sense, lies between the m=1 and m=2 BA-model graphs, at least considering just these two outline and interconnection features, by visual determination. It’s also worth noting that as m is increased, the BA-model produces graphs where the power-law component of the degree distributions becomes weaker and weaker, at least for models fitted over a wide-range of the data:

Degree distributions of the Barabási-Albert model, across a range of values of the m and m0 parameters. Nonlinear, least-square fits of power-law models, for the highest m0 for each m of the data-sets. Increases in m decrease the dominance of the power-law component.
There is however a very simple tweak that can be made to the BA-model that can produce a graph with both these features. This tweak produces results with both the correlation outline and the range of connections between:

BA Model with “min” tweak, m = 1, eigencentrality ordered adjacency matrix plot.
While not terribly affecting the degree distribution, other than pushing down the power-law exponent, as is to be expected with the increased connectivity:

BA Model, with “min” tweak, degree distributions for a range of m parameters.
The tweak made to the BA-model is fairly simple, rather than adding strictly m edges with each node, instead add at least m edges, by considering all existing nodes independently of each other, for adding nodes. The m parameter becomes a minimum, rather than a strict requirement. This can even potentially greatly speed-up graph generation, in vectorised implementations, by avoiding having to iterate or communicate globally so as to ensure a strict requirement is met. For iterative implementations, it will be slower though.
An iterative Java implementation can be downloaded from here. A GNU Octave implementation is shown below (which should also be straight-forward to make work in MatLab, if it doesn’t already), which is much faster in “min” mode:
# Barabási-Albert (BA) scale-free, preferential-attachment graph
# generation model, as per "Emergence of Scaling in Random Networks".
#
# N: the number of vertices
# m: number of edges to add per step
# m0: the number of initial edges (must be greater than m, defaults to m +
#     1)
# a: an additive boost, governing initial attractiveness of a node,
# from Dorogovtsev, et al, "Structure of Growing Networks
# with Preferential Linking", Phys. Rev. Lett., 2000. Default is 0,
# in which case the model is identical to the original BA model.
#
# mode: "strict" or "min" Whether to use the "strict" definition of
# Barabási-Albert and add /exactly/ m edges per step; or be more relaxed
# (and potentially much more efficient) and treat m as a minimum and
# add /at least/ m edges per step.
function G = scale_free (N, m, m0 = m + 1, a = 0, mode = "strict")
	G = sparse (N,N);

	for i = 2 : m0 + 1
		G(i, i - 1) = 1;
	endfor

	G= G | G';

	for i = m0 + 1: N
		connect = scale_free_add (G, i, m, a, mode);
		G(connect,i) = 1;
		G(i,connect) = 1;
		#disp(["adde]);
	endfor
	G = G | G';
endfunction

function connect = scale_free_add (G, n, m, a = 0, mode = "strict")
	ki = sum(G(1:n - 1,1:n-1));
	sumkj = sum(ki);
	pi = (a + ki)/sumkj;

	connect = zeros (1, n - 1);

	while (sum(connect) < m)
 		connect |= (pi >= rand (1,n - 1));
	endwhile

	if (strcmp (mode, "strict") && sum(connect) > m)
		perm = randperm (n - 1);
		c = connect(perm);
		added = 0;
		# a binary search would make this faster
                # or perhaps using sort
		for i = 1:columns(c)
			if (added < m)
				added += c(i);
			else
				connect(perm(i)) = 0;
			endif
		endfor
	endif
endfunction
It’s a very simple tweak, but does seem to produce something sufficiently different from the “strict” cases, and in between m=1 and m=2 to perhaps be interesting. Though, I havn’t looked further at trying quantify it yet. The performance benefits of staying in vectorised library code, and avoiding having to iterate, are quite significant in the Octave implementation – though, the “strict” edge quota-meeting in the above could also be still improved a lot.
When it comes to relevance to BGP AS graphs, there are a number of further models that try to simulate additional, graph-evolving processes, beyond just preferential-attachment. E.g., the addition of links between similar nodes, or the death of nodes, etc. This (trivial) tweak might also be relevant to their preferential-attachment component.
Hopefully it’s useful to someone! (Probably not 😉 ).

The surprising centres of the Internet | Paul Jakma's Blog said
[…] previous post, on “Barabási – Albert preferential attachment and the Internet“, gave a plot of the Internet, as a sparsity map of its regular adjacency matrix, with the […]